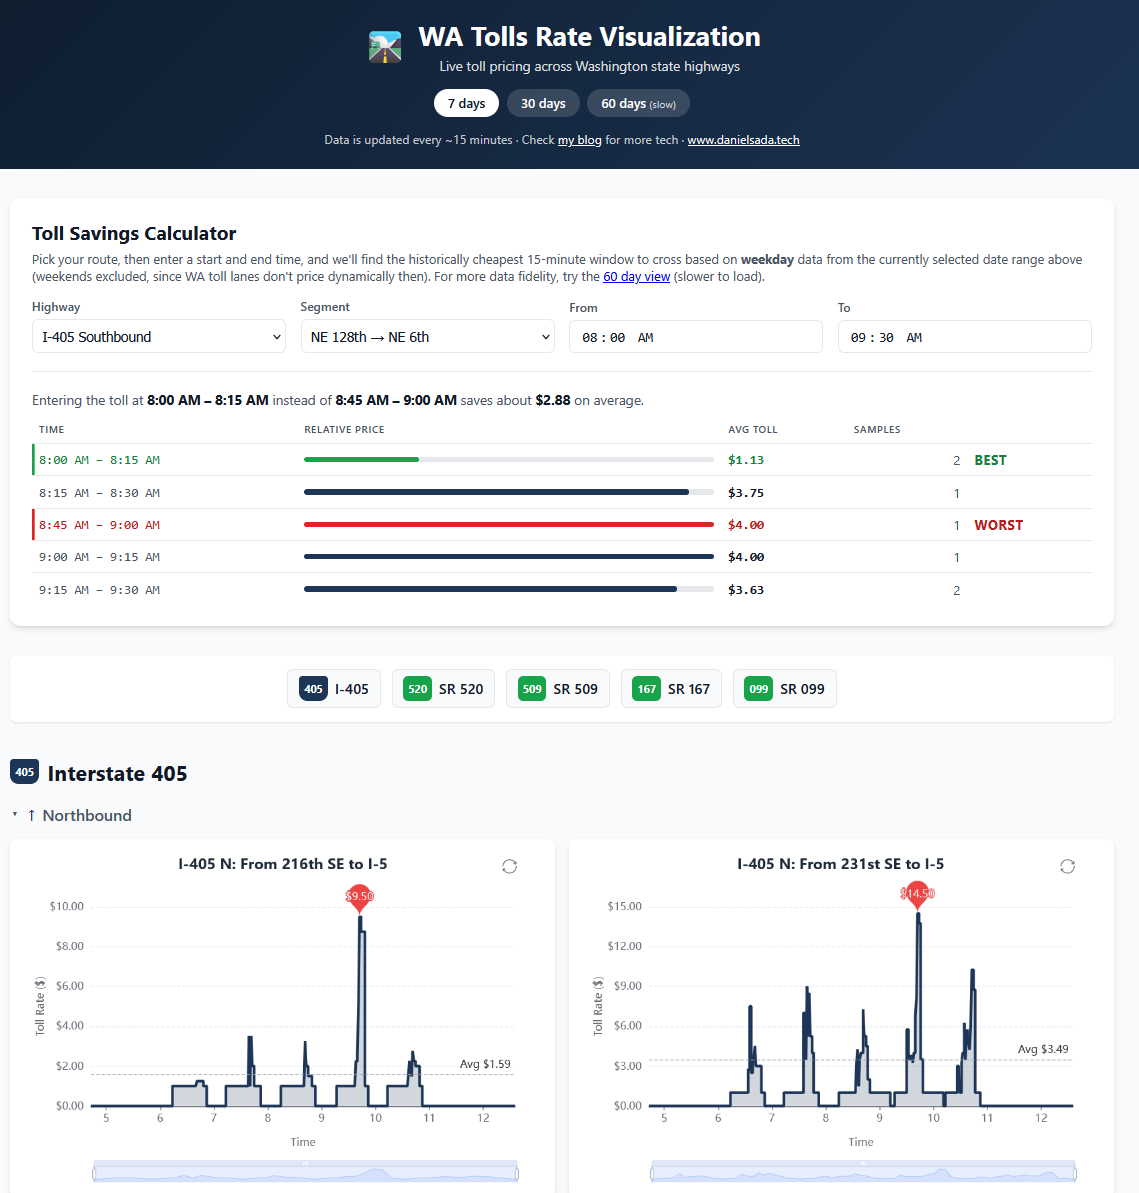
I live in Washington State. Whenever I am rushing to get to a meeting or needing to get somewhere fast, I sometimes take toll roads to get there faster. As I took them more, I noticed that I didn’t know what time to take them to get to my destination with the minimum payment possible. Some mornings I would leave at 8 and pay more than if I left at 7 for the same stretch of road. Other days I would give up, wait until 9, and mysteriously get charged just a couple of dollars.
Washington has dynamic toll lanes, and the price to cross changes based on traffic, sometimes every few minutes, and it can swing from a couple of dollars to well over ten. The state only ever shows you the price right now. There is no way to see whether 8 is usually worse than 7, or whether that 9 o’clock dip I kept hitting happens most days. Nobody was showing me the history, so I built it myself. The result lives at watolls.danielsada.tech.
The whole thing is three small pieces that do one job each. I wanted to make sure I didn’t build something the internet could charge me thousands for, so I mainly just built a static site with some orchestration behind it.
1. Collect the data to a DB
The state publishes a public API with current toll rates for every priced segment. It gives you the current price, the start and end location, the route, and a direction. The catch is that it only tells you now. There is no history, so if you want to see patterns you have to record them yourself.
So the first piece is a small Python script that hits the API, cleans up the response, and writes it into a Postgres table. The WSDOT timestamps come in a slightly odd format, and prices arrive in cents, so most of the code is just normalizing things into something sane. I round every reading to the nearest minute so the data lines up neatly when I chart it later.
I run this on a schedule, roughly every fifteen minutes. That cadence is enough to catch the price movements without drowning the database in near-identical rows.
2. Process it.
The second piece is a tiny Go API. It reads from Postgres and hands back the toll history as JSON for a given date range.
The one interesting bit here is deduplication. Toll prices tend to sit flat for long stretches, so a naive query gives you hundreds of rows that all say “the price is still 2.75”. For a chart, that is just noise. So the API collapses runs of identical values down to the first and last point of each run. If the raw series looks like this:
1, 1, 1, 2, 2, 2, 2, 1, 1, 1
it comes out like this:
1, 1, 2, 2, 1, 1
Same shape when you draw it, a fraction of the payload. The API bakes the last 7, 30, and 60 days into static JSON files into blob storage so the frontend never has to wait on a live query.
3. Staticly chart it and serve it.
The third piece is a static Hugo site. It pulls the pre-baked JSON from blob storage and draws a chart per segment using ECharts. You can flip between the 7, 30, and 60 day views. That is the boring, useful part.
The fun part is the savings calculator. You pick a route, tell it roughly when you want to travel, say between 8 and 10 in the morning, and it looks back through the weekday history to find the cheapest 15-minute window to actually cross. It compares that against the worst window in the same range and tells you how much you would save on average.
I only use weekday data for this, because the toll lanes do not price dynamically on weekends, so mixing them in would just muddy the average. Turns out that on some segments, leaving fifteen minutes earlier genuinely saves a few dollars a trip. Over a year of commuting that adds up.
Why split it into three?
I could have jammed all of this into one thingamajig. But separating collection, serving, and presentation means each part can fail or change on its own. If the chart breaks, the data still gets collected. If I want to swap the frontend, the blob storage does not care. The Python script does not know or care that a website exists.
It is a small project, but it helps me and now I actually check it before driving. I hope I can help a couple of commuters plan their tolls better (and I hope to not suffer from success and normalize demand for the toll lanes).
Go try it at watolls.danielsada.tech. Any feedback is welcome.