Over my work in different scales of services, I’ve noticed that there is a common pattern in some of these services that makes them easier to approach and cause less headaches to the engineers that handle them. When we deal with millions of users making requests all the time across the world, I’ve noted that there are a few things that help a lot of people to sleep at night comfortably. This is a quick guide on how to be web scale [meme].
This is not a comprehensive list, but the things I’ve seen that actually help or have helped me in the past.
Easy Level
These steps are relatively easy to implement but yield high return on investment. If you aren’t doing it, you’ll be surprised how good quality of life is after you start adopting these.
Infrastructure as Code.
The first part of guranteeing sleep is having Infrastructure as Code. That means that you have a way of deploying your entire infrastructure. It sounds fancy, but in reality, we are saying in code:
Deploy 100 VMs
- with ubuntu
- each one with 2GB RAM
- they'll have this code
- with these parameters
And you can track changes to the infrastructure and revert quickly via source control.
Now, the modernist in me will say “We can use kubernetes/docker to do everything on this list!” You are correct, but for now, I’m going to err on the side of an easy explanation on this blog.
If you are interested in this you can check out Chef, Puppet, Salt, Ansible, or Terraform
Continuous Integration/Delivery
Having a build, and test pass run against each one of your pull requests is essential to building a scalable service. Even if the testpass is basic, it will at least guarantee that the code you are deploying compiles.
What you have to answer everytime you do this step, relates to the question Is my build going to compile, pass the tests I’ve set up, and it’s valid?, this might seem like a low bar, but this catches a myriad of issues you wouldn’t imagine.
 Nothing more beautiful than seeing those checkmarks.
For this technology you can check out Github, CircleCI or Jenkins
Load balancers
Ok, so you have your machines, or endpoints, but you really want to have a load balancer to redirect traffic for having equal loads in all your nodes or redirect your traffic in case you have an outage.
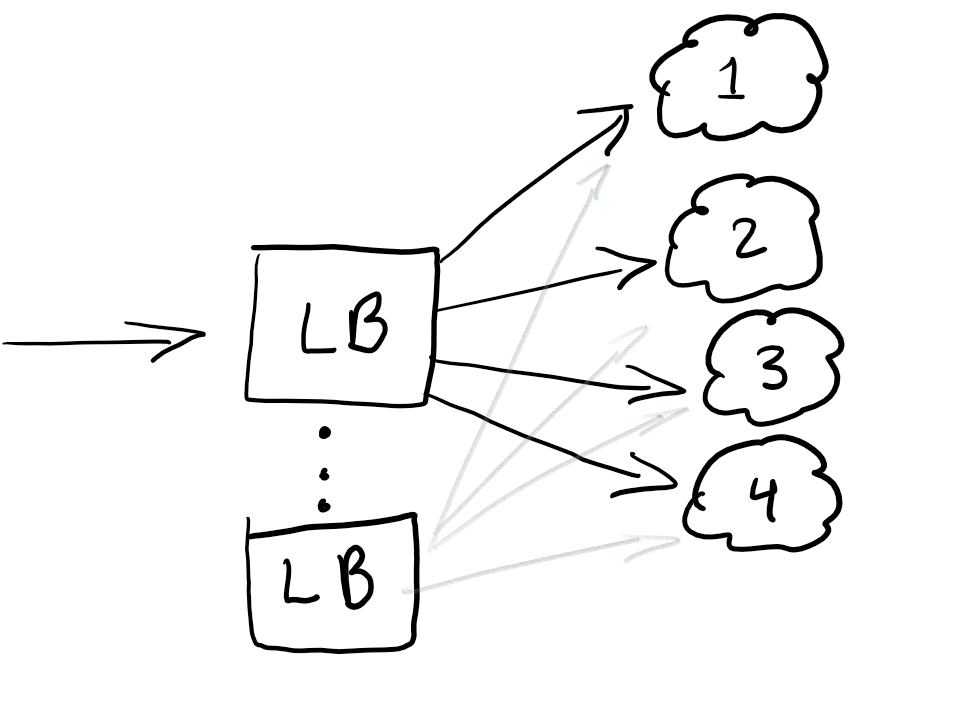
Having load balancers at the start of your traffic is generally a good thing. A best practice is also having redundant load balancing so that you don’t have a single point of failure.
Usually, load balancers are configured in your own Cloud, but if you know some good ones, leave them below in the comments.
RayIDs, Correlations or UUIDs for requests.
Have you ever got an error in an application that tells you something along the lines of Something wrong happened, save this id and send it to our support team?
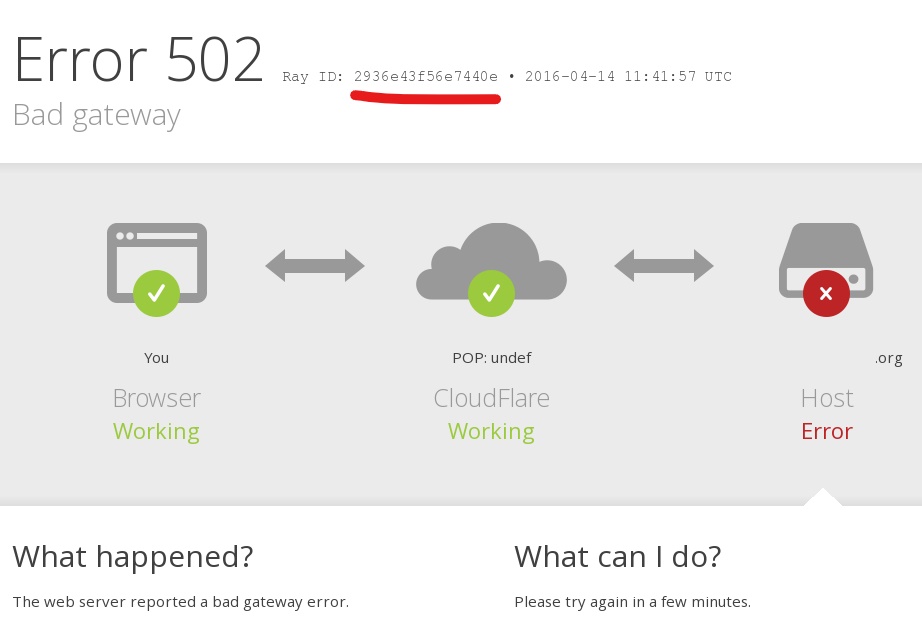
A unique ID, correlation ID, RayID or any of its variations, is a unique identifier which allows you to trace a request through its lifecycle, therefore allowing someone to see the entire path of the request in the logs.
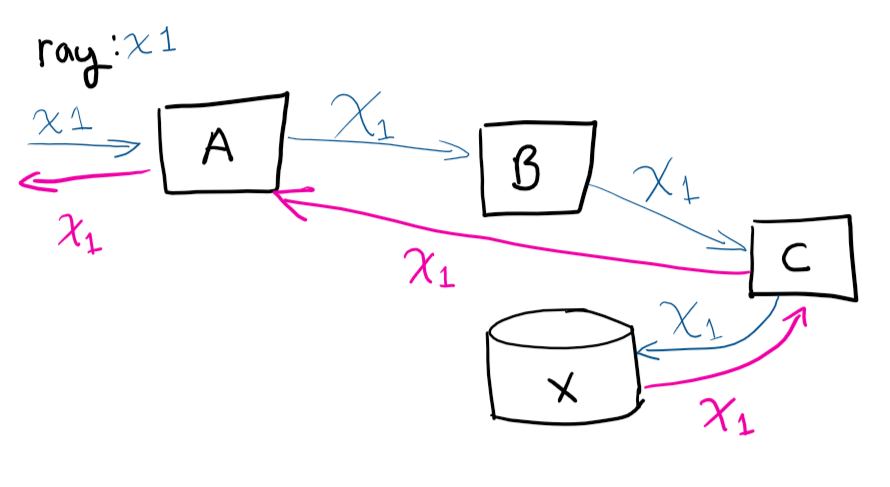
As you can see in the image above, the user makes a request to system A, A then talks to B, B talks to C, saves to X and then returns to A.
If you were to remote into the VMs and try to trace the path, (and manually correlate which calls belong), you’d go crazy. Having the unique identifier makes your life a lot easier, this is one of the easier things you can do in your service, that will save you a lot of time as your service grows.
Medium Level
These are usually more complicated than the previous ones, but if you grab the right tools, it can be easy, the ROI for small to medium companies is easy to justify.
Centralized logging
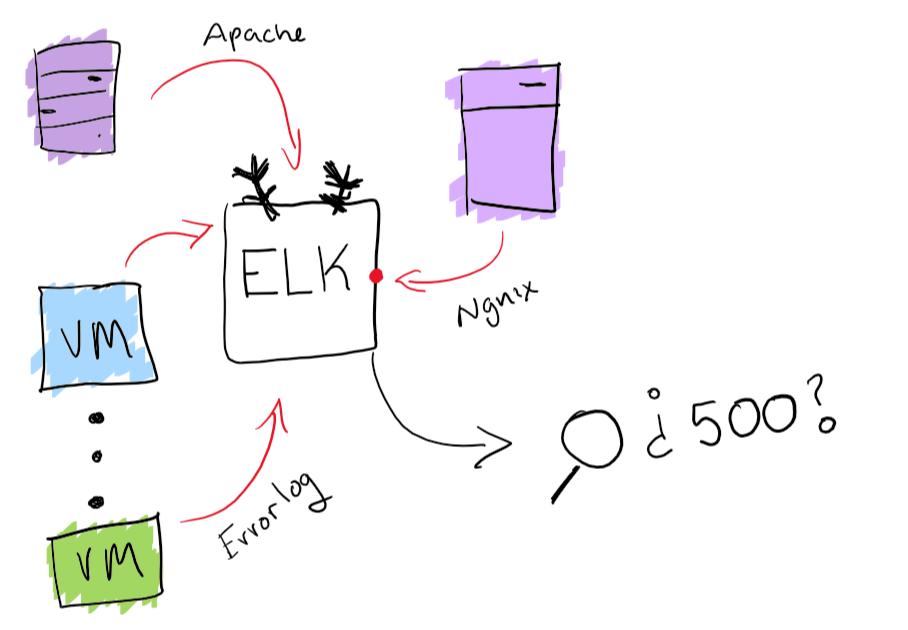
Congratulations! You deployed 100 VMs. The next day, the CEO comes with an error he had while testing the service. He gives you the above correlation ID, but then you have to scramble to look in the 100 machines which one was the one that failed. And it has to be solved before the presentation tomorrow.
While that sounds like a fun endeavor; make sure to get one place to search your logs from. The way I’ve centralized my logs before, is with ELK stack. Having log collection and searchability is going to really improve your experience searching for that one unexpected log. Extra points if you can also generate charts and fun things like that.
Monitoring Agents
Well, now that your service is deployed, you have to make sure it stays up! The best way to do that, is to have some agents running against your service and checking whether it’s up, and that common operations can be done.
In this step you have to answer: Is the build I deployed healthy and does it work fine?
I personally recommend Postman for small to medium projects that need to be monitored against and documented in their APIs. But in general, you want to make sure you have a way of knowing if your service is down and provide timely alerts.
Automatic Autoscaling based on load
This one is simple. If you have 1 VM serving requests, and it’s getting close to >80% memory, you might want to either grow the VM or add more VMs to your cluster. Having these operations done automatically is great for being elastic under load. But you always have to be careful in how much money you spend and set sensible limits.
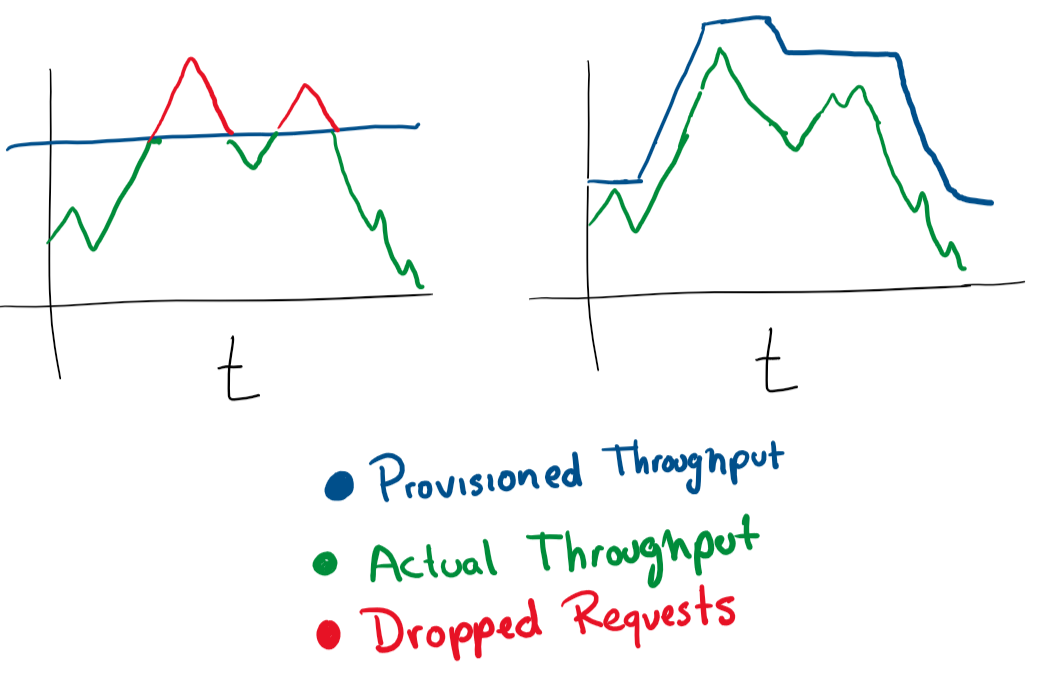
You can configure auto-scaling in most cloud services, via more machines, VM or more powerful machines.
Experiment system
Having a way to test out things to 1% of your users for an hour is a good way to deploy changes safely. You’ve seen these kinds of systems in action. Facebook will give you a different color or change the size of a font to see if that is more pleasing. This is also called AB testing.
Even releasing a new feature could be under an experiment, and then determine how it’s released. What people don’t realize is that you also get the ability to “recall” or change configuration on the fly, which given a feature that will take your service down, the ability to scale it back is amazing.
Hard Level
These are actually hard, somewhat difficult to implement, you probably need a bit more resources to do these. So, for a small or medium company, it’s going to be hard to push with these.
Blue-Green deployments
This is what I call the “Erlang” way of deploying. When Erlang started being used more widespread, back when telephone companies started communicating people together, there was a point where software switchboards were used to route phonecalls. The main concern about the software in these switchboards was not to ever drop calls while upgrading the system. Erlang has a beautiful way of loading a module without ever dropping the previous one.
This step depends on you having a load balancer. Let’s imagine you have a specific version N of your software, then you want to deploy version N+1. You could just stop the service and deploy the next version “in theory” in a convenient time for your users and get some downtime, but in general, let’s say you have really strict SLAs. A 4 9’s means you can only have 52 minutes down a year.
If you really want to achieve that, you need to have two deployments at the same time, the one you have right now (N) and your next version (N+1). You point the load balancer to redirect a percentage of the traffic to the new version (N+1) while you actively monitor for regressions.
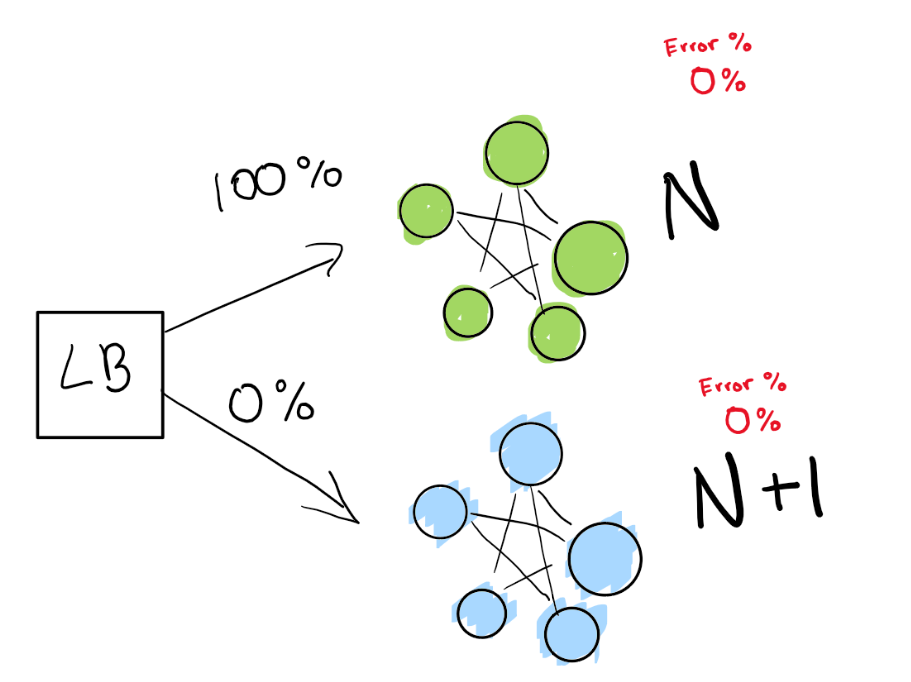
Here, we have our green deployment N, which is healthy! We are trying to move to the next version of this deployment.
We send out first a really small test to see whether our N+1 deployment is working with a bit of traffic.
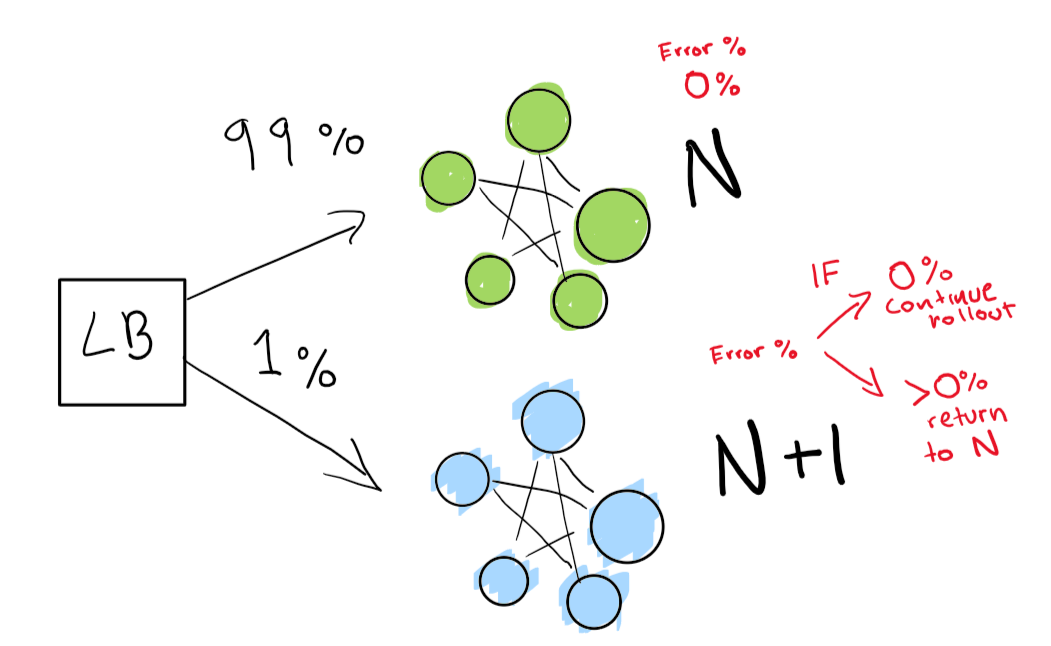
Finally, we have a set of automated checks that we end up verifying until our rollout is complete. If you want to be really really careful, you can also keep your N deployment “forever” for a quick rollback given a bad regression.
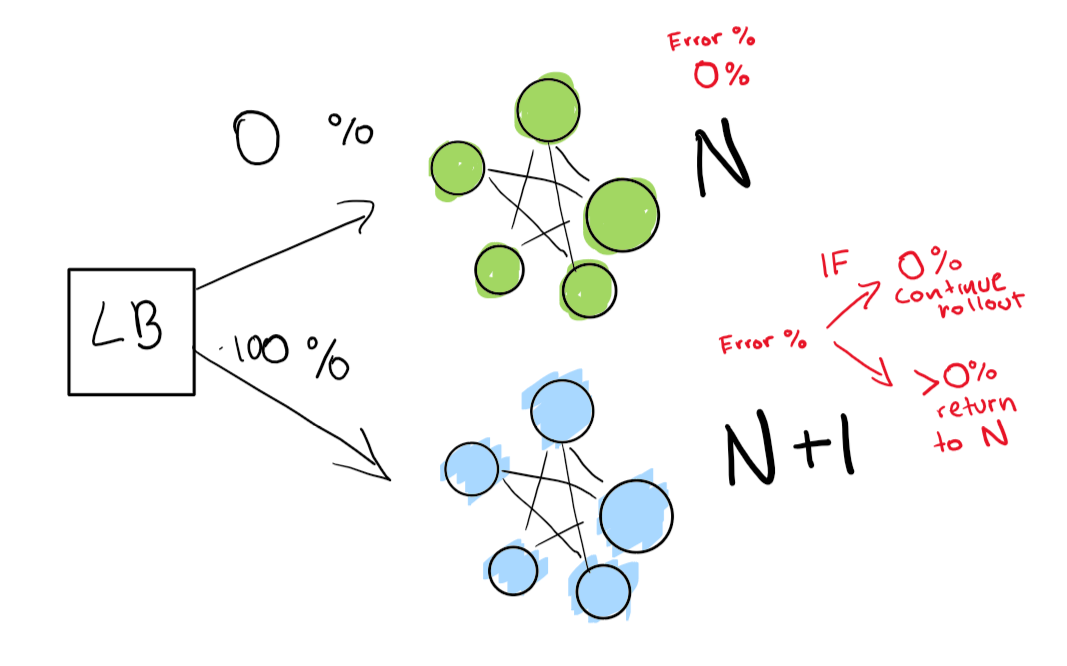
If you want to even go into a deeper level, have everything in the blue-green deployment execute automatically.
Anomaly Detection and automatic mitigations.
Given that you have centralized logging, and some good log collection, flights all the elements above. We can now be proactive about catching failures. On our monitors, and on our logs, we feed our features and different charts and we are able to be proactive to when something is going to fail.

With anomaly detection you start looking into some of the “tells” of the service, whether a spike in CPU will let you know when your hard drive is going to fail, or a spike in request # means you need to scale up. Those kinds of statistical insights will empower your service to be proactive.
Once you have those analytics, you can scale on any dimension, proactively and reactively change machines, databases, connections or other resources.
This requires a really good system, or ML prowess, which then makes it more interesting in the sense that the investment is really high, and the return is high on a massive scale.
This is it!
I’m certainly not an expert in any of these, and I’m starting my career, but this list of priorities per stages would have saved me a lot of headaches in the past.
I’m really interested in hearing from you: what would you add to this list? Comment down below or in HN.
This article is open source, feel free to make a PR in GitHub.